The Illusion of Insight: What Jira Can (and Can't) Tell You About Engineering Performance
Why Jira only gets you part of the way when understanding how your team builds software
Jira is the heartbeat of many software teams. It tracks everything from story points to sprint velocity, and it powers standups, retros, and sprint reviews. But when it comes to truly understanding how your team builds software (where time is spent, what's slowing them down, and how to coach them better) Jira leaves you squinting through a fog of tickets and tags.
Combining Jira data with signals from a Slack standup bot gives you a much more complete picture of how your team is actually doing.
Jira ≠ Engineering Observability
Jira is great at tracking tickets. But tickets are just one part of the development process. What happens in Git, code review, CI/CD, and even Slack is just as critical to understanding productivity, team health, and bottlenecks.
What Jira Actually Measures vs What It Misses
Before diving into Jira's limitations, let's acknowledge what it does well:
What Jira Measures Effectively:
- Task completion: How many tickets moved from "To Do" to "Done"
- Sprint velocity: Story points completed over time
- Workload distribution: Who has how many tickets assigned
- Issue types: The mix of bugs, features, and technical debt
- Time tracking: How long tickets stayed in each status (if teams actually update them)
These metrics aren't useless — they provide a rough sense of throughput and workload balance. The problem is that many managers mistake these activity indicators for performance insights.
What Jira Completely Misses:
- Code quality and complexity: A 5-point story that requires refactoring legacy code is fundamentally different from a 5-point story that adds a new API endpoint
- Collaboration and mentoring: Time spent helping teammates, participating in design discussions, or unblocking others
- Learning and growth: Skill development, research, experimentation, and knowledge transfer
- Communication patterns: How well engineers communicate blockers, ask questions, and share context
- Problem-solving approach: Whether engineers tackle root causes or apply quick fixes
- Team dynamics: Who's engaged, who's struggling, who's becoming a go-to resource
- Context switching costs: How often engineers are pulled between different types of work
- Technical debt creation vs reduction: Whether the work is making the system better or worse long-term
Jira sees tickets moving through columns. It doesn't see the human layer that actually builds software.
The Story Points Fallacy
Story points are perhaps the most misused metric in software development. Originally designed as a rough sizing tool for sprint planning, they've become a proxy for productivity measurement — and that's where things go wrong.
Why Story Points Don't Measure Performance:
1. Arbitrary and Inconsistent Scaling
A "5-point story" means completely different things to different teams, and even within the same team over time. Points are relative estimates, not absolute measures of effort or value.
2. Gaming and Inflation
When managers use story points for performance evaluation, engineers naturally inflate estimates to make their velocity look better. A task that would have been 3 points becomes 5 points to pad the numbers.
3. Complex Work Gets Undervalued
Pointing typically underestimates research, debugging, and technical debt work while overvaluing straightforward feature development. An engineer who spends a sprint preventing a major outage through careful refactoring might complete fewer "points" than someone adding basic CRUD endpoints.
4. No Quality Weighting
Story points treat all completed work equally. An engineer who ships buggy code that requires three follow-up fixes gets the same "velocity" credit as someone who ships production-ready code the first time.
5. Individual vs Team Context
Comparing individual story point completion ignores the reality that senior engineers often spend time mentoring, designing systems, and unblocking others — work that rarely translates to personal velocity metrics.
A Better Approach:
Use story points for what they were designed for: sprint capacity planning. For performance evaluation, look at:
- Impact of work delivered: What problems were solved? What value was created?
- Quality indicators: Bug rates, code review feedback, production stability
- Collaboration contributions: How much did they help teammates succeed?
- Growth demonstrated: What new skills or responsibilities did they take on?
As one VP of Engineering put it: "I've never seen a story point shipped to production. I've seen features, bug fixes, and improvements that customers use."
Why Velocity is Misleading
Team velocity — the average story points completed per sprint — is supposed to help with predictable planning. In practice, it often becomes a performance KPI that actively damages team health.
The Velocity Optimization Trap
When teams are pressured to increase velocity, they optimize for the metric rather than for outcomes:
- Point inflation: Stories get artificially sized larger to boost numbers
- Scope reduction: Teams avoid difficult but necessary work that might slow velocity
- Technical debt accumulation: Quick fixes win out over sustainable solutions
- Learning time elimination: Research and skill development get deprioritized
- Collaboration reduction: Helping teammates becomes a "velocity tax"
Why Velocity Varies (And That's Normal)
Sprint Composition Matters: A sprint with mostly new feature work will have different velocity than one focused on bug fixes or technical debt.
External Dependencies: Velocity drops when waiting for design assets, API access, or approvals — none of which reflect team performance.
Learning Curves: When tackling new technologies or domains, initial velocity naturally decreases as the team gains expertise.
Team Maturity: New teams have lower velocity until they develop working relationships and shared understanding.
Context Switching: Teams jumping between multiple projects or responding to urgent requests show velocity fluctuations.
Code Quality Focus: Teams that emphasize testing, documentation, and code review may show lower sprint velocity but higher long-term productivity.
A Real Example:
Team A consistently delivers 40 story points per sprint with minimal bugs and happy stakeholders.
Team B delivers 60 story points per sprint but generates significant tech debt and customer complaints.
Which team is performing better? Jira's velocity metric suggests Team B. Reality suggests Team A.
Better Velocity Questions:
- Is the team delivering predictable value to customers?
- Are sprint commitments reliable and achievable?
- Is technical quality maintaining or improving over time?
- Do team members feel sustainable workloads?
Velocity is a planning tool, not a performance measure.
What Signals Exist Outside Jira
The most important engineering signals happen outside Jira, in the tools and conversations where actual work gets done:
Git and Version Control Signals
- Commit frequency and patterns: Regular, small commits suggest good development practices
- Branch lifetime: Long-lived branches often indicate scope creep or integration challenges
- Code churn: How much code gets rewritten shortly after being written
- Collaboration patterns: Who's contributing to whose code, suggesting knowledge sharing
Code Review and Pull Request Data
- Review participation: Who's actively helping teammates improve code quality
- Feedback quality: Are reviews catching real issues or just style nitpicks
- Review turnaround time: How quickly the team provides and incorporates feedback
- Approval patterns: Are reviews rubber stamps or thoughtful quality gates
Slack and Communication Signals
- Standup engagement: Detailed updates suggest team investment; brief responses might indicate disengagement
- Question-asking patterns: Engineers who ask good questions are learning and engaged
- Help-offering behavior: Who volunteers solutions when teammates are blocked
- Escalation patterns: How quickly and effectively issues get raised to management
CI/CD and Production Signals
- Build success rates: Higher failure rates might indicate code quality issues or test gaps
- Deployment frequency: Teams deploying more often typically have better development practices
- Rollback frequency: How often deployments need to be reversed
- Alert response: How quickly and effectively the team responds to production issues
Meeting and Collaboration Signals
- Design discussion participation: Who contributes to architectural and product decisions
- Retrospective engagement: Quality of improvement suggestions and follow-through
- Knowledge sharing: Presentation of learnings, documentation creation, mentoring activity
- Cross-team collaboration: How well engineers work with product, design, and other engineering teams
External Feedback Loops
- Customer support tickets: Are features working as expected for users
- Stakeholder satisfaction: How product and business teams feel about engineering delivery
- User metrics: How deployed features actually perform in production
These signals paint a much richer picture of engineering effectiveness than Jira tickets alone.
Building a Complete Picture
Effective engineering management requires combining Jira data with these external signals to understand the full story:
Layer 1: Delivery Context (From Jira)
- What work was completed
- How scope changed during development
- Where bottlenecks occurred in the workflow
- How accurately the team estimated effort
Layer 2: Quality Signals (From Git and CI/CD)
- How much code was written vs rewritten
- How well tested the delivered features are
- How stable the production deployments have been
- How efficiently the development process flows
Layer 3: Collaboration Patterns (From Slack, Git, and Reviews)
- Who's mentoring and being mentored
- How knowledge is shared across the team
- Where communication breaks down
- Who's becoming a go-to resource for different areas
Layer 4: Team Health (From Communication and Behavioral Patterns)
- Who's engaged vs showing signs of burnout
- How well the team handles challenges and setbacks
- Whether workload distribution feels sustainable
- How effectively blockers get identified and resolved
Layer 5: Impact and Growth (From Outcomes and Learning)
- Whether delivered features solve real problems for users
- What new capabilities team members have developed
- How the team's technical practices are evolving
- What organizational knowledge has been created or transferred
Example: Synthesizing the Full Picture
Jira shows: "Alex completed 23 story points this sprint with 2 spill-over tickets."
The complete picture shows:
- Git activity: Regular commits with clear messages, active in 3 repositories
- Code reviews: Provided detailed feedback on 8 PRs, caught 2 potential security issues
- Slack patterns: Asked thoughtful questions in standup, helped 2 teammates with debugging
- Collaboration: Led design discussion for new API, presented learnings from recent conference
- Impact: Features deployed with zero production issues, positive feedback from product team
The second view tells you Alex is a growing technical leader. The first view tells you almost nothing.
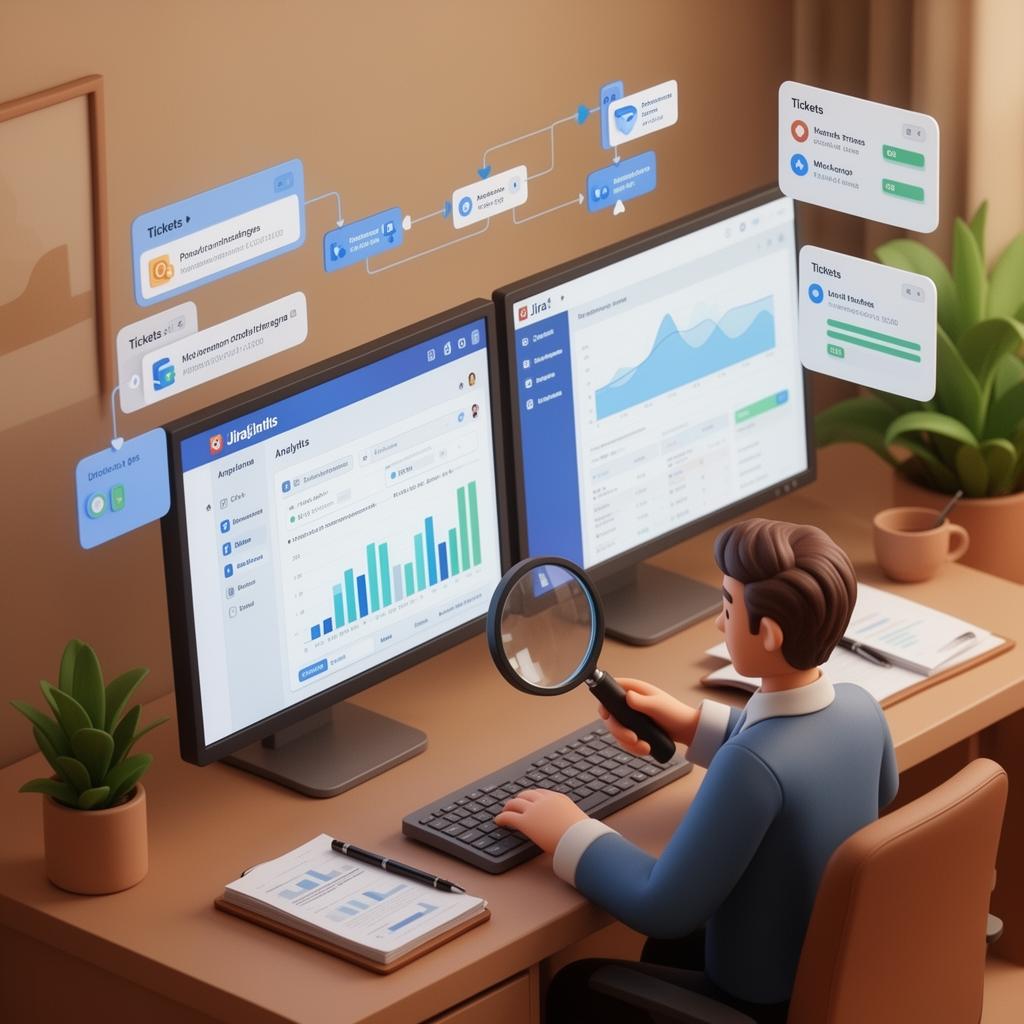
How Vereda AI Connects These Data Sources
Manually correlating signals across Jira, Git, Slack, and other tools is time-consuming and error-prone. Vereda AI automates this integration:
Unified Data Collection
Vereda AI connects to your existing tools:
- Jira: Ticket completion, sprint progress, and workload distribution
- GitHub/GitLab: Code contributions, review participation, and collaboration patterns
- Slack: Standup responses, communication quality, and engagement levels
- CI/CD systems: Build success rates, deployment frequency, and production stability
Intelligent Pattern Recognition
AI identifies connections humans miss:
- An engineer with declining Jira velocity who's actually spending time mentoring (visible in code reviews and Slack)
- Sprint scope creep correlating with specific types of requirements (visible in ticket updates and standup feedback)
- Code quality improvements following team retro action items (visible in Git metrics and review feedback)
Contextual Performance Insights
Instead of isolated metrics, Vereda AI provides integrated assessments:
"Sarah completed 18 story points this sprint (below her 25-point average), but her code review participation increased 40% and she led 3 architecture discussions. Her lower ticket velocity reflects increased technical leadership, not decreased productivity."
Predictive Risk Detection
By analyzing patterns across data sources, AI can flag potential issues early:
- Declining standup engagement combined with reduced code review participation might indicate burnout risk
- Increasing build failures alongside shorter commit messages might suggest code quality concerns
- Reduced cross-team collaboration combined with growing Jira backlogs might indicate bottlenecks
Automated Insights for Managers
Vereda AI generates actionable summaries:
- Which engineers are becoming technical leaders (based on mentoring and design participation)
- What process improvements are working (based on delivery and quality trends)
- Where the team might be accumulating technical debt (based on code patterns and revert frequency)
- Who might benefit from focused 1:1 conversations (based on engagement and performance patterns)
Learn more about how Vereda AI creates comprehensive engineering insights by connecting your development tools.
Closing Thought: Jira Is a Piece of the Puzzle—Not the Whole Picture
Jira will always be part of your stack. But when it comes to truly managing engineering performance, coaching developers, or improving delivery, you need more than issue statuses and sprint points.
The limitations are clear:
- Jira captures activity, not impact
- It measures task completion, not team health
- It tracks individual tickets, not collaborative contributions
- It shows what was planned, not what was learned
The solution isn't to abandon Jira — it's to augment it with the signals that matter most:
- Communication patterns that reveal engagement and collaboration
- Code quality metrics that show sustainable development practices
- Learning and growth indicators that predict long-term team success
- External feedback that validates whether delivered features actually solve problems
You need visibility. Context. Clarity. The kind of insight that turns metrics into momentum.
And that's where Vereda AI comes in.
By connecting Jira data with Git, Slack, and other development tools, Vereda AI provides the complete picture that individual tools can't offer. Instead of squinting through a fog of tickets and points, you get clear insights into team performance, individual growth, and delivery effectiveness.
The future of engineering management isn't about better Jira reports — it's about better integration of all the signals your team already produces.
For related insights, read our guides on using data for better performance reviews and detecting team health issues early.